The user interface is basically divided into four areas:
Except for the performance data table, all areas can be collapsed and expanded.
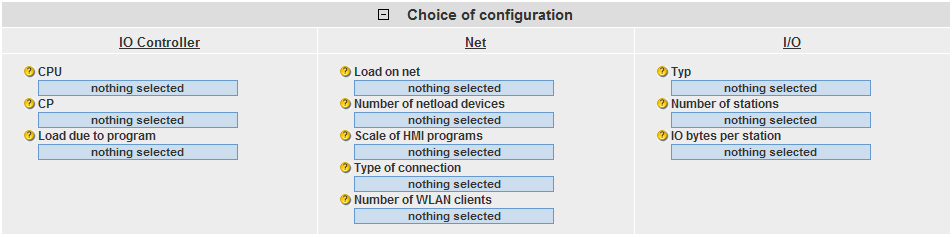
A.) Selection Area
In this area, you can enter your desired configuration using the relevant operator controls. The system supports you by different automatic functions.
| Legend | Explanation |
|---|---|
|
|
The parameter has not yet been set. |
|
|
The available parameter has been set by you. |
|
|
The parameter has been set automatically by the system. Due to the selection of another control (internal rules), the range of values had to be limited. |
|
|
Click on the rubber icon to reset the selection. |
|
|
The "filter icon" indicates that at least one filter is active in the selection area. |
|
|
Collapse input area - expand input area |
B.) Performance Requirements
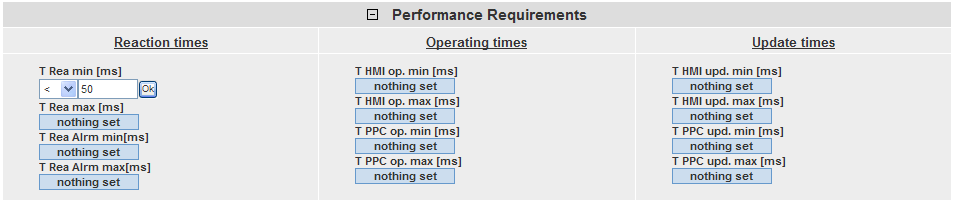
In this area, you can use numeric filter conditions, which appear when clicking on the respective control, to limit the measured result values. In this example, the minimum PN reaction time is to be less than 50 ms. In addition to the filters of the selection area, this filter will now be used for the result table.
C.) Chosen Configuration
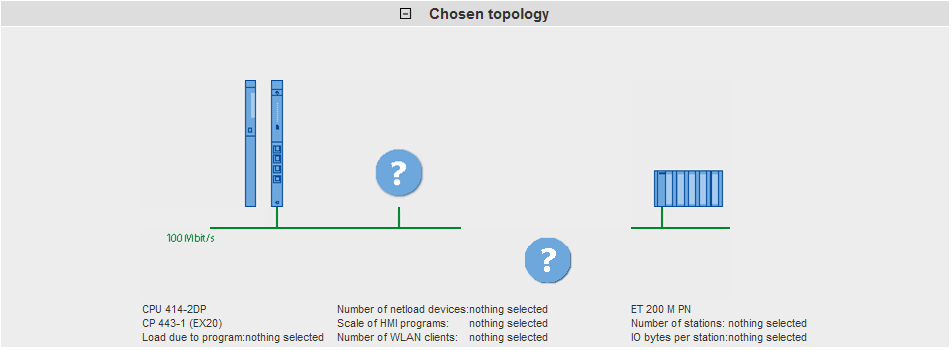
In the "Chosen Configuration" area, the system shows you the graphical structure of your configuration. If no input has yet been made for one or several controls in the selection area, this is indicated by a question mark displayed in the specific area.
D.) Performance Data Table

This area displays the measured performance data with all filters you have selected. The displayed columns can be shown or hidden using a dialog box by clicking on "Show columns".