3.5. Measured variables and statistics
Position parameter
To make statements on the significance of the average value (median), the further statistical position parameters should also be taken into consideration. All measured variables are repeated several times for this (up to 200 individual measurements). The measuring system calculates the following statistical values, from all the measured values. The statistical values can be selected by the user in the result table.
| Position parameter |
Definition |
| TransTime_min |
The lowest value in the series of measurement that is no outlier. |
| TransTime_Q25 |
The first quartile (Q25) states that 25% of the actually measured values are below this number |
| TransTime_avg |
The Median (Q50) specifies the measured value which divides the number of sorted measured values into two equally large halves. This position parameter is the most important one in the table of measured values and by default is automatically displayed in the result table. |
| TransTime_Q75 |
The third quartile (Q75) states that 75% of the actually measured values are below this number |
| TransTime_max |
The highest value in the series of measurement that is no outlier. |
| Outliers[%] |
The percentage of outliers among all the measured values. |
50% of all measured values lie in the so-called interquatrile range (IQR), the area between TransTime_Q25 and TransTime_Q75. This area enables the user to derive a statement on spread and reliability of the mean value (median).
In this measurement, statistical outliers are defined as follows: If a measured value lies above or below the area Q75 + 1.5 * IQR or Q25 - 1.5 * IQR, it counts as outlier.
Notice
The “normal” TransTime_min or TransTime_max value is corrected accordingly for outliers, which means as soon as an outlier value (Outlier[%]) unequal 0 appears in the result table, the max/min value does not correspond to the maximum/minimum value measured in the measuring series!
Interpretation
The spread of the measured values can be detected via the standardized statistical box plot representation.
Examples:
| BoxPlot |
Position parameter |
Interpretation |
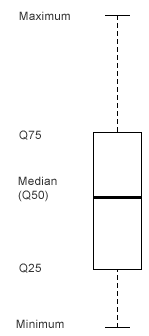 |
The maximum of the measured values here is slightly asymmetrical to the rest.
50% of all measured values lie in the IQR range (Q25 to Q75). In this example, this area is relatively large as compared to the second example.
The median (Q50 value) lies fairly symmetrically in the IRQ range. |
There is a small upward deviation in this measurement.
50% of all measured values are scattered relatively widely, i.e. for this measurement the entire IRQ range is more likely.
|
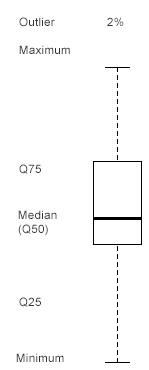 |
2% of all measured values are outliers.
50% of all measured values lie in the IQR range (Q25 to Q75). This measurement is much narrower as compared to the first example. |
The maximum value to be expected without outliers is revised downwards.
50% of all measured values are scattered relatively narrowly. For this constellation the results and the values of the median are very meaningful and likely. |