3.9. Measured variables and statistics
Position parameter
To make statements on the significance of the average values (median), the further statistical position parameters should also be taken into consideration. All measured variables are repeated several times for this (up to 500 individual measurements). From the entity of the measured values the gauge calculates the following statistical values which can be selected by the user in the result table.
| Position parameter |
Definition |
| TransTime_min |
The smallest measured value in the series of measurements |
| TransTime_Q25 |
The first quartile (Q25) states, that 25% of the actually measured values are below this number |
| TransTime_avg |
The Median (Q50) specifies the measured value which divides the number of sorted measured values into two equally large halves. This position parameter is the most important one in the measured value table. |
| TransTime_Q75 |
The third quartile (Q75) states, that 75% of the actually measured values are below this number |
| TransTime_max |
The largest measured value in the series of measurements |
50% of all measured values lie in the so-called interquatrile range (IQR), the area between TransTime_Q25 and TransTime_Q75. This area enables the user to derive a statement on spread and reliability of the mean value (median).
Interpretation
The spread of the measured values can be detected via the standardized statistical box plot representation.
Examples:
| BoxPlot |
Position parameter |
Interpretation |
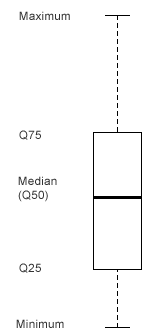 |
The maximum of the measured values is here slightly asymmetrical to the rest.
50% of all measured values lie in the IQR range (Q25 to Q75 ). In this example, this area is relatively large compared with the second example.
The median (Q50 value) lies fairly symmetrical in the IRQ range. |
There is a small upward deviation in this measurement.
50% of all measured values are scattered relatively wide, i.e. for this measurement the entire IRQ range is more likely.
|
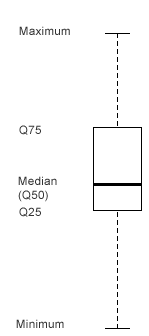 |
50% of all measured values lie in the IQR range (Q25 to Q75 ). This measurement is much more narrow compared with the first example. |
50% of all measured values are scattered relatively narrow. For this constellation the results and the values of the median are very meaningful and likely. |
Notice:
Especially for non-deterministic Windows PC systems there may occasionally be extreme outliers regarding the maximum value. The median value has the greatest informative value for PC measurements!