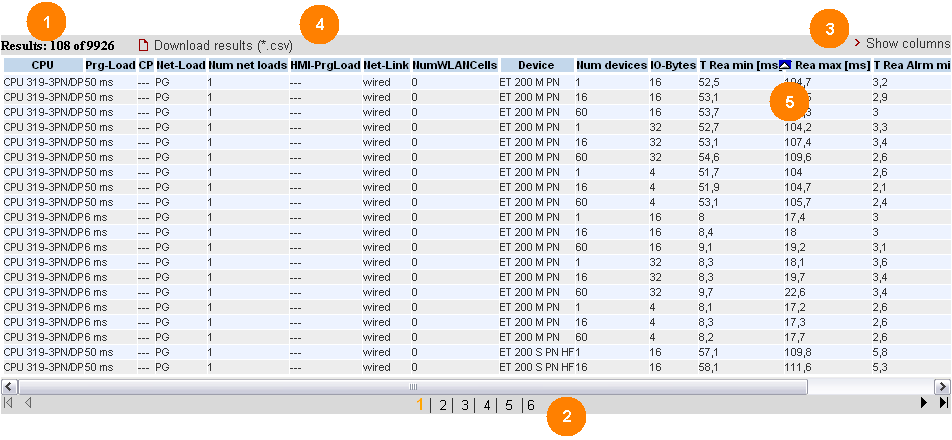
The table of performance data shows the database contents of the associated measurement in compliance with the restrictions defined by the previously defined filters. This area is permanently visible. By default, the table displays only a selection of the columns that are available in the database for this measurement. In a dialog window you can select or deselect the individual columns.
Control elements of the table
Explanation of the control elements
| Display element | Explanation |
|---|---|
|
1 |
The table control shows
|
|
2 |
If the results extend over several pages, you can use the elements of the table's control bar to select specific result pages or to jump to the next, previous, last or first page. |
|
3 |
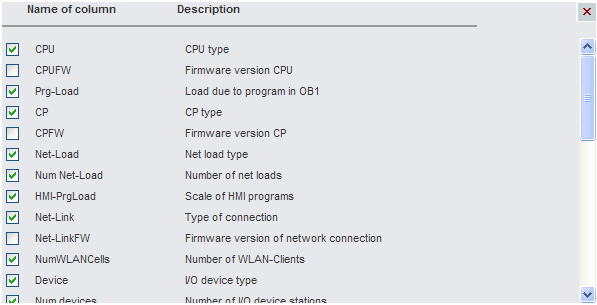
Click the "> Show columns" control element to open a dialog box where you can select or deselect individual columns.
|
|
4 |
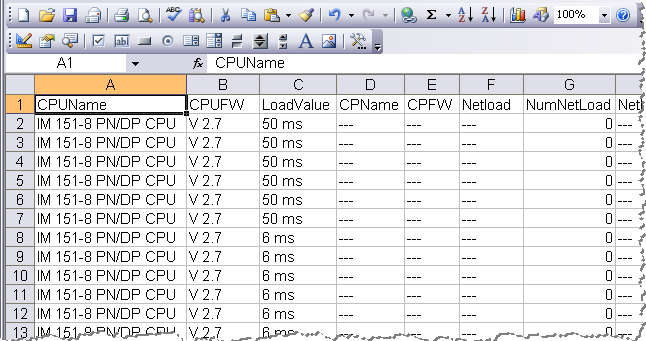
Click "Download results (*.csv)" to download all contents of the results table from the web server to the client browser in the form of a csv-file. Depending on the browser and the Excel version installed, the data will be instantly displayed in an Excel spreadsheet.
|
|
5 |
Click the column header of the measurement values (in this example - TransTime_min) to initiate sorting of the table according to this criterion. If you click a column header, the sorting status of the relevant column will be changed.
Note: Only one column can be sorted at a time ! |
Meaning of the columns
All column headers are also explained in tooltips.
| Column name | Explanation |
|---|---|
| CPU | CPU type |
| CPUFW | CPU firmware status |
| Prg-Load | Load from program in OB1 |
| CP | CP type |
| CPFW | CP firmware status |
| Net-Load | Type of the additional network load on PROFIBUS (PG or HMI panel) |
| Num Net-loads | Number of additional network loads |
| HMI-PrgLoad | Scope of the HMI panel configuration |
| Net-Link | Network connection (wired/ wireless) |
| Net-LinkFW | Firmware status of network connection (if wireless) |
| NumWLANCells | Number of WLAN clients |
| Device | I/O device type |
| Num devices | Number of I/O device stations |
| I/O bytes | Total number of configured I/O bytes |
| I/O bytes PI | I/O bytes via process image |
| T Rea min[ms] | Minimum PN reaction time via process image [ms] |
| T Rea avg[ms] | Average PN reaction time via process image [ms] |
| T Rea max[ms] | Maximum PN reaction time via process image [ms] |
| Cycle time min[ms] | Minimum OB1 cycle time[ms] |
| Cycle time avg[ms] | Average OB1 cycle time[ms] |
| Cycle time max[ms] | Maximum OB1 cycle time[ms] |
| T HMI upd.min[ms] | Minimum update time on the HMI panel [ms] |
| T HMI upd.avg[ms] | Average update time on the HMI panel [ms] |
| T HMI upd.avg[ms] | Maximum update time on the HMI panel [ms] |
| T_HMI op.min [ms] | Minimum operating time on the HMI panel [ms] |
| T_HMI op.avg [ms] | Average operating time on the HMI panel [ms] |
| T HMI op.max [ms] | Maximum operating time on the HMI panel [ms] |
| T PPC upd.min[ms] | Minimum update time on the PanelPC [ms] |
| T PPC upd.avg[ms] | Average update time on the PanelPC [ms] |
| T PPC upd.max[ms] | Maximum update time on the PanelPC [ms] |
| T PPC op.min[ms] | Minimum operating time on the PanelPC [ms] |
| T PPC op.avg[ms] | Average operating time on the PanelPC [ms] |
|
T PPC op.max[ms] |
Maximum operating time on the PanelPC [ms] |
 Unsorted values
 Sorts the values in an ascending order
 Sorts the values in a descending order